
Are you looking to elevate your data analysis and presentation skills within Excel? This comprehensive review explores Pine BI, an innovative Excel add-in designed to simplify the creation of insightful charts and interactive dashboards.
We delve into its core functionalities, explore practical applications, and assess its overall value, especially concerning the exclusive AppSumo offering. Discover how Pine BI can transform your spreadsheets into powerful visual tools.
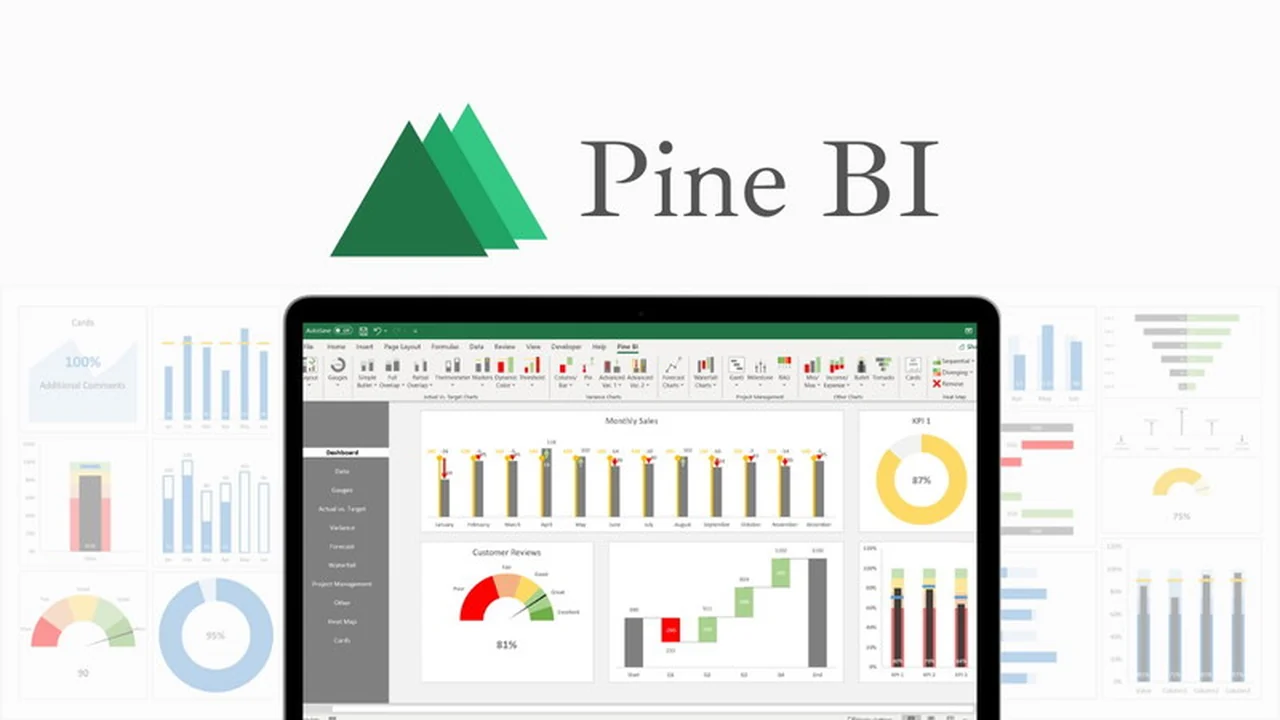
What is Pine BI | AppSumo
Pine BI is an Excel add-in that provides a suite of advanced charting and dashboarding tools directly within your familiar spreadsheet environment. It aims to streamline the process of transforming raw data into visually appealing and informative dashboards, accessible to users of all Excel skill levels.
Key Features
- Automated Navigation Menu: Automatically adds a navigation pane to your workbooks, enhancing organization and user experience.
- Multi-Chart Editing: The Pine BI Chart Editor allows for simultaneous editing of multiple charts, saving significant time and effort.
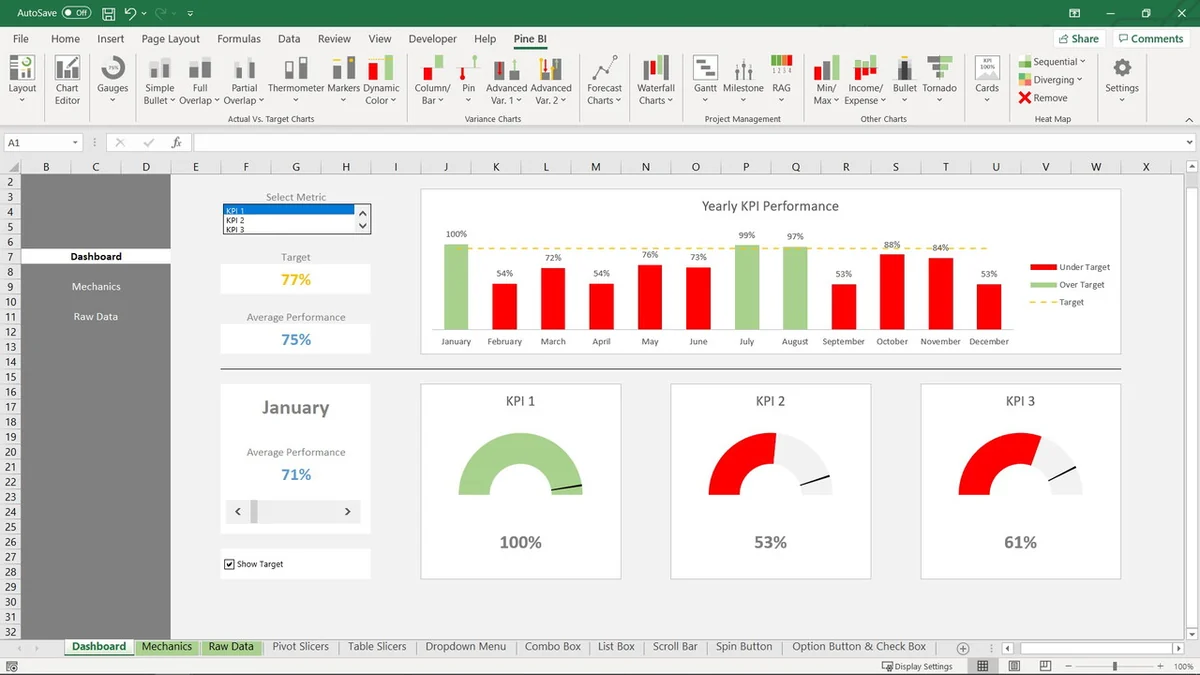
- Diverse Chart Types: Create a wide array of specialized charts, including Gauges, Waterfall, Gantt, Bullet, and Actual vs. Target charts, with speed and ease.
- Dynamic PowerPoint Presentations: All Pine BI visualizations can be seamlessly integrated into PowerPoint, retaining their dynamic properties for engaging presentations.
- Viewer Accessibility: Users who do not own Pine BI can still view and even edit all created visualizations and dashboards, facilitating collaboration.
- Lifetime Updates: Included with each license, ensuring you always have access to the latest features and improvements.
How It Works
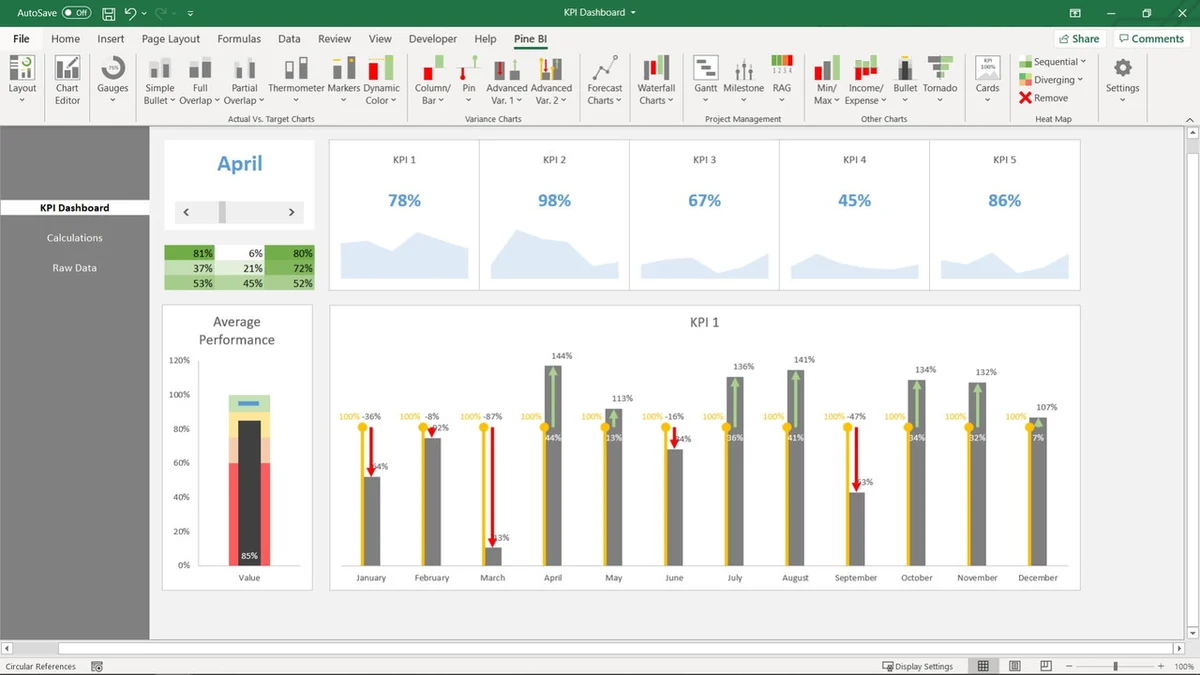
Upon installation, Pine BI integrates a new tab into your Excel ribbon, offering a user-friendly interface with numerous charting and dashboarding options. Users select their data, choose from the extensive library of chart types, and customize them using intuitive tools. The add-in automates many complex formatting and layout tasks, allowing for rapid creation of professional-looking dashboards and reports directly within Excel.
Use Cases
- Business Performance Dashboards: Visualize key performance indicators (KPIs) and track progress against targets.
- Sales and Marketing Analysis: Create compelling charts to illustrate sales trends, campaign effectiveness, and customer data.
- Project Management: Utilize Gantt and Waterfall charts to map out project timelines and resource allocation.
- Financial Reporting: Develop clear and concise financial reports with specialized charts like Actual vs. Target.
- Data Storytelling: Transform complex datasets into easily understandable visual narratives for stakeholders.
Integrations & Compatibility
- Pine BI functions as an add-in for Microsoft Excel
- While its primary integration is within the Excel ecosystem, visualizations can be exported and utilized in other presentation software, notably PowerPoint, where they retain dynamic properties
- For users working with other data sources, integration capabilities depend on how data is brought into Excel.
Pricing & Value
The value proposition of Pine BI, particularly through the AppSumo deal, is significant. It offers a lifetime access to a powerful suite of tools that would otherwise require extensive manual effort or more expensive specialized software. The inclusion of future updates and premium features further enhances its long-term value, making it a cost-effective solution for individuals and businesses looking to improve their data visualization capabilities.
Deal Details
The AppSumo deal for Pine BI typically includes lifetime access to all current and future features, as well as ongoing updates. It’s important to note that codes must be redeemed within 60 days of purchase. This particular deal is not stackable, meaning each purchase provides a distinct license. A 60-day money-back guarantee is available, allowing ample time to test the software’s suitability.
Quick Take
- Ideal for Excel users who want to create professional dashboards quickly.
- Offers a wide range of specialized charts and intuitive customization tools.
- Provides excellent value with lifetime access and future updates.
FAQs
What happens if I don’t own Pine BI?
Users without Pine BI can still view and edit all visualizations and dashboards created by others.
Is Pine BI compatible with Mac?
Pine BI is an Excel add-in, and its functionality is dependent on the Excel version and operating system compatibility.
How do I redeem my AppSumo code?
Redeem your code by emailing it or submitting it via the website’s contact form for manual fulfillment within 24 hours.
Does the AppSumo deal include all advertised features and future updates?
Yes, all advertised features and future upgrades are included with the Pine BI AppSumo purchase.
Can the charts be animated?
Pine BI itself does not offer animation features, but charts can be animated within PowerPoint after import.
Final Thoughts
Pine BI | AppSumo presents a compelling opportunity for anyone who regularly works with data in Excel. Its ability to quickly transform complex datasets into sophisticated, dynamic visualizations significantly reduces the time and effort typically associated with creating professional dashboards. The lifetime access, ongoing updates, and user-friendly interface make it a standout tool for enhancing data analysis and presentation, ultimately empowering users to communicate their findings more effectively.


Leave a Reply