
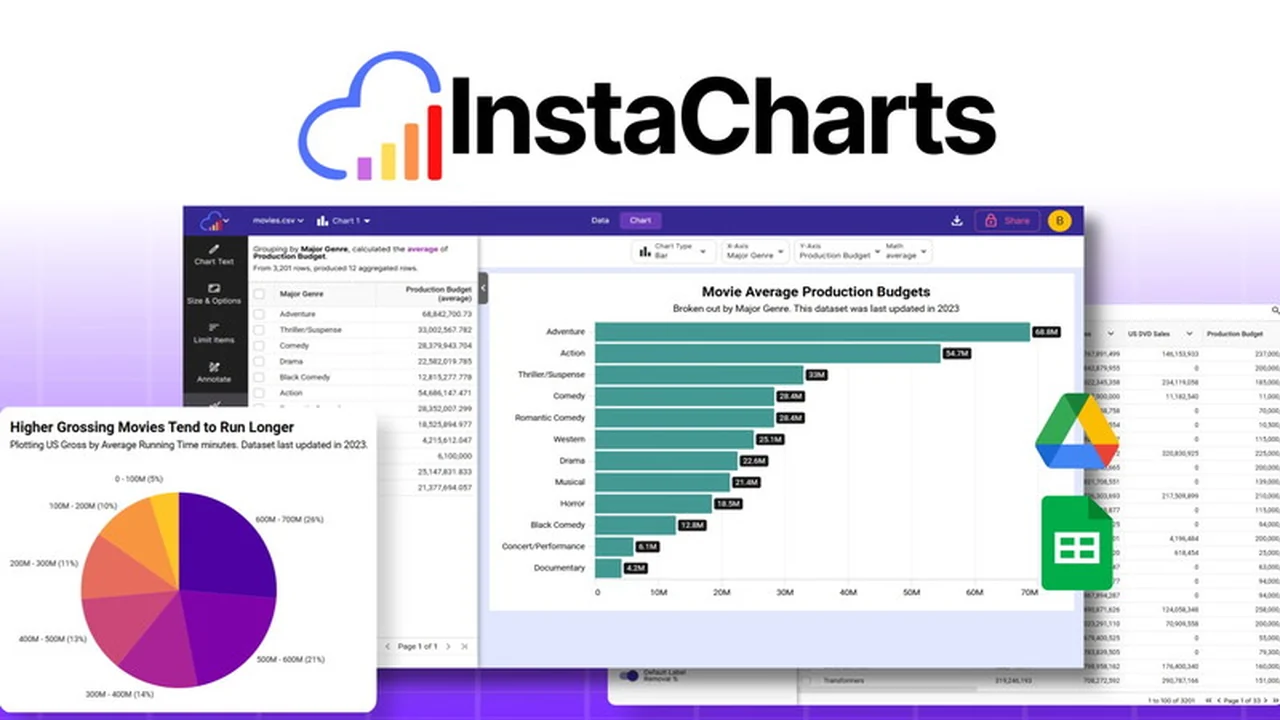
Discover how InstaCharts can transform your data visualization process, offering a streamlined approach to creating and sharing compelling charts directly from your spreadsheets and other data sources.
This review will guide you through its core functionalities, use cases, and overall value, helping you understand if InstaCharts is the right tool for your needs.
What is InstaCharts | AppSumo
InstaCharts is a user-friendly application designed to simplify the creation and sharing of interactive charts and data tables. It aims to remove the complexity often associated with data visualization, allowing users to generate insights quickly from various data inputs without requiring advanced technical skills.
Key Features
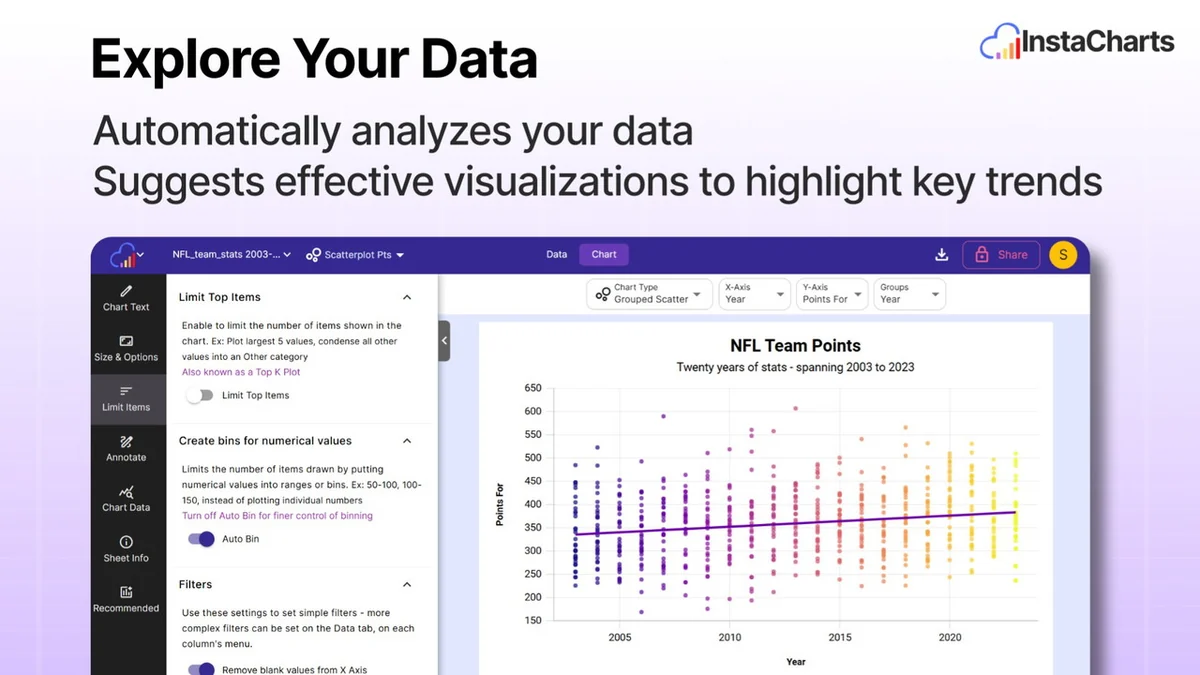
- Automatic Chart Generation: Upload your spreadsheet or JSON file, and InstaCharts intelligently analyzes your data structure to recommend and create the most suitable chart types.
- Multiple Data Sources: Supports a wide range of file formats including .csv, Excel, .tsv, .json, and .log. It also offers seamless integration with Google Sheets and Google Drive for easy data access and collaboration.
- Interactive Visualizations: Charts and data tables are interactive, allowing for dynamic filtering, sorting, and data manipulation, which aids in testing hypotheses and exploring data from different angles.
- Diverse Chart Types: Offers a selection of 10 chart types, including line, bar, area, pie, scatterplot, and a data table visualization.
- Easy Embedding: Provides simple copy-and-paste embed codes for seamless integration into websites, blogs, and other platforms like WordPress, Substack, and Ghost.
- Data Syncing: Option to pull data from Google Sheets or Google Drive files and set a refresh schedule (hourly, daily, or monthly) to keep visualizations up-to-date with the original data source.
- Static Image Export: Allows for the creation and sharing of high-quality static chart images (.svg or .png) for use in reports or presentations.
- No-Code Templates: Utilizes chart templates for rapid creation of no-code interactive charts that can be shared as standalone pages or embedded.
How It Works
Getting started with InstaCharts is straightforward. The primary method involves uploading your data file. InstaCharts then automatically processes the information, identifies trends, and generates a relevant chart. For dynamic data, you can connect directly to Google Sheets or Google Drive, setting up automatic syncs to ensure your visualizations always reflect the latest information. Sharing is as simple as copying an embed code to integrate the interactive charts or data tables into your preferred online platform.
Use Cases
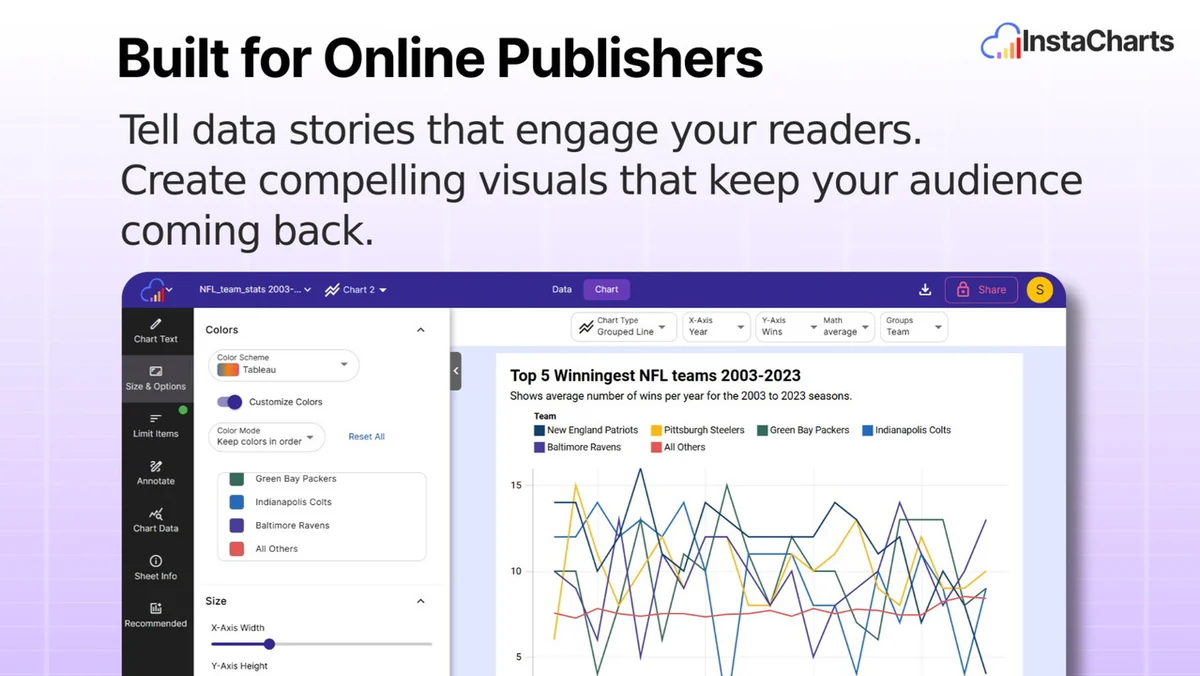
- Content Creators: Embed interactive charts and data tables into blog posts or articles to enhance reader engagement and provide clear data insights.
- Marketers: Visualize campaign performance data, customer demographics, or market trends to inform strategy and present findings.
- Educators: Create engaging visual aids for lessons, making complex data more accessible and understandable for students.
- Business Analysts: Quickly generate charts for internal reports, client presentations, or to explore business metrics and identify key performance indicators.
- Researchers: Visualize research data, experiment results, or survey findings in an easily shareable and embeddable format.
Pricing & Value
InstaCharts offers a compelling value proposition, especially through its lifetime deal options. The ability to create, share, and embed interactive charts without recurring subscriptions provides significant long-term savings compared to traditional SaaS models that can often range from $29 to $240 or more depending on the plan and features required.
Deal Details
The current AppSumo deal provides lifetime access to InstaCharts. This includes all updates and future feature releases. Key aspects of the deal typically involve redeeming codes within 60 days of purchase to ensure activation of the lifetime access.
Quick Take
- Ideal for content creators, marketers, and educators looking for rapid, no-code chart creation.
- Excellent for embedding interactive data visualizations into websites and blogs.
- A cost-effective solution for those who need to visualize data frequently without ongoing subscription costs.
FAQs
Is there a money-back guarantee?
Yes, InstaCharts comes with a 60-day money-back guarantee for your peace of mind.
How often can I sync data from Google Sheets?
You can set data syncs to occur hourly, daily, or monthly.
Can I embed InstaCharts charts on my website?
Absolutely, InstaCharts provides embed codes for easy integration into most websites and platforms.
Are the charts generated by InstaCharts interactive?
Yes, InstaCharts creates interactive charts and data tables that users can filter and sort.
What types of files can I upload to InstaCharts?
InstaCharts supports .csv, Excel, .tsv, .json, and .log files, along with Google Sheets and Google Drive integration.
Final Thoughts
InstaCharts | AppSumo presents a robust and accessible solution for anyone needing to visualize data without a steep learning curve. Its automated chart generation, straightforward embedding process, and interactive capabilities make it a valuable tool for a wide range of users. The lifetime access offered through AppSumo further enhances its appeal, providing a cost-effective way to access powerful data visualization features long-term. For individuals and businesses seeking to communicate data insights more effectively and efficiently, InstaCharts is certainly worth considering.